Advanced Product Segmentation: POAS, Price Benchmark, and Product Groups
Performance segmentation is the foundation – but not the whole picture. To truly maximize Shopping campaign profitability, you need additional layers: profit-based optimization (POAS over ROAS), price benchmarking, and product group structure.
Advanced Product Segmentation: POAS, Price Benchmark, and Product Groups
Why ROAS alone isn't enough – and which segmentation layers actually make the difference
Already segmenting your products by performance? Good. But what if your top performer runs on a 2% margin – and you're actually losing money on every sale?
In our previous article, we covered performance-based segmentation – Performers, Growers, Underperformers, and Invisibles. That's the foundation. But there are three more layers that separate "decent" results from truly profitable campaigns.
Here's what they are – and how to put them into practice.
Segmentation by Product Groups, Product Types, and Brands
Sounds obvious? Maybe. But that's exactly why this step gets skipped so often.
Classic segmentation by product groups (e.g., shoes, jackets, accessories), product types (running shoes vs. sneakers vs. hiking boots), and brands is the backbone of any campaign structure. Without it, you're flying blind.
Why it matters
Imagine a fashion store spending 60% of its budget on accessories – while 80% of revenue comes from outerwear. Without product group segmentation, you'd never notice. With it, you steer deliberately: each category gets its own budget and bidding strategy.
Don't forget brands
Brand segmentation gets especially interesting when certain brands perform significantly better or carry higher margins. A premium brand with 40% margin needs a different strategy than a no-name brand at 10%.
The goal: Your campaign structure reflects your actual business – not a flat "everything in one bucket" approach.
Profit-Based Segmentation: POAS over ROAS
ROAS of 10 – popped the champagne. Then calculated the margin – put the cork back in. A high ROAS doesn't automatically mean high profit. Optimizing for revenue alone can still lose you money.
ROAS (Return on Ad Spend) measures revenue per ad dollar. The problem: revenue isn't profit. A product with €100 revenue and €5 margin at €10 ad spend has a ROAS of 10 – sounds amazing, but it's actually a loss-maker.
What is POAS?
POAS stands for Profit on Ad Spend – profit generated per ad dollar. Instead of revenue, actual profit becomes the benchmark:
Profit = Sale Price − Cost of Goods (COGS) − Ad Spend
The example that explains everything
Two products, same ROAS – completely different outcomes:
Product A:
- Sale price: €100, COGS: €40
- CPC: €2, Conversion rate: 5%
- Ad cost per sale: €40
- → ROAS: 2.5 → Profit: €20 per sale ✅
Product B:
- Sale price: €100, COGS: €85
- CPC: €2, Conversion rate: 5%
- Ad cost per sale: €40
- → ROAS: 2.5 → Loss: -€25 per sale ❌
Same ROAS. Completely different outcome. That's why you need POAS.
Prerequisite for POAS: Cost of Goods Sold (COGS) must be available per product – ideally directly in your feed or via a tool that merges the data.
How to segment by profit
Group your products into margin tiers:
- High margin (>30%): Bid more aggressively – there's enough room for profit
- Medium margin (15–30%): Standard strategy, clean optimization
- Low margin (<15%): Careful – POAS optimization becomes essential here
The key takeaway: Optimizing for ROAS alone might mean optimizing for revenue that generates no profit. POAS shows you what actually stays in your pocket.
Segmentation by Google Benchmark Price
The third layer is one many advertisers aren't even aware of: your price position relative to competitors.
What is the benchmark price?
Google automatically compares your product's price with the same product's price at other retailers. This creates three categories:
- Above benchmark: Your price is higher than average
- At benchmark: Price is comparable to competitors
- Below benchmark: You're cheaper than most
Real-world analogy: Advertising products above benchmark is like running ads for a restaurant that's more expensive than every neighbor. People walk in, compare the menu – and leave for the place next door. You pay for the click but get no conversion.
What this means for your campaigns
The logic is straightforward:
- Products above benchmark → Reduce budget or pause. You're paying for clicks that rarely convert because users compare prices instantly on Google Shopping.
- Products at benchmark → Normal competitive environment. Other factors like reviews, shipping costs, and product images make the difference.
- Products below benchmark → Bid more aggressively. Conversion probability is higher because you're competitively priced.
Important caveat
This applies mainly to price-sensitive products – electronics, commodities, consumables. For premium brands or niche products, price sensitivity is lower. People buy because they want exactly this product – not the cheapest one.
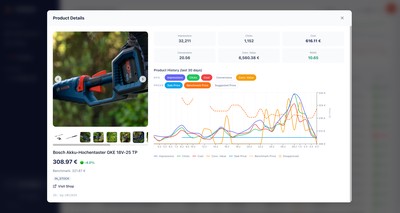
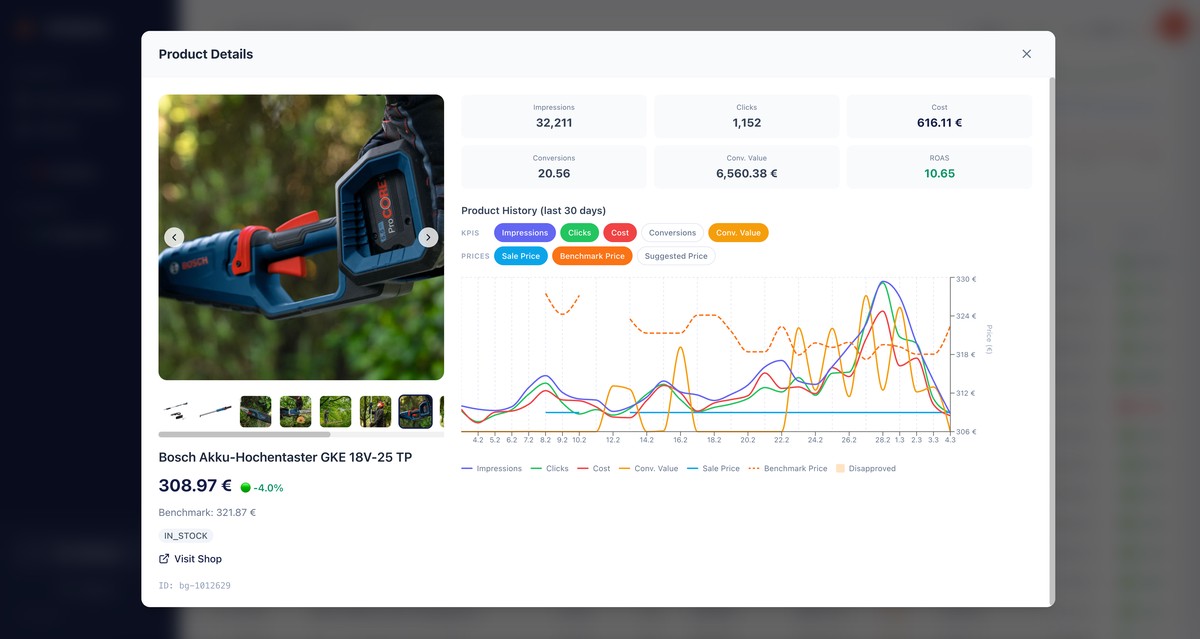
Benchmark data comes directly from Google Merchant Center. In practice, you can see the price position directly in your product overview and filter accordingly.
Putting it all together: Combining segmentation layers
Sweet Spot
Performer + high margin + below benchmark = maximum budget. You earn on every click.
Danger Zone
Performer + low margin + above benchmark = ROAS looks great, but profit is negative.
Hidden Potential
Grower + high margin + below benchmark = increasing visibility here pays off big.
Budget Trap
Underperformer + low margin + above benchmark = pause immediately, triple negative.
The four segmentation layers – performance, product group, profit, and price – don't replace each other. The real picture only emerges when you combine them.
The right order
- Performance segmentation as the foundation (Performers, Growers, Underperformers, Invisibles)
- Product groups/brands for campaign structure
- Profit tiers for bidding strategy
- Price benchmark as an additional filter
You don't need to implement all four layers at once. Start with performance, then add the others step by step. Each layer makes your campaigns a bit more profitable.
Bottom line: ROAS alone isn't enough
Performance segmentation shows you what works. Profit segmentation shows you whether it's worth it. And price benchmark segmentation shows you whether you even stand a chance.
Optimizing for ROAS means optimizing for revenue. Optimizing for POAS means optimizing for profit. Add the benchmark price, and you stop wasting ad spend on clicks that were never going to convert.
The goal isn't a dashboard with a hundred segments. The goal is: You know for every product whether it's worth advertising. And with the right data, that's easier than you think.