Campaign-Level Budget Allocation: When More Budget Helps — and When It Just Gets More Expensive
More budget doesn't automatically mean more revenue. Learn how to use ROAS data, Impression Share, and product performance to identify which campaigns should be scaled — and which ones are burning your budget.
Campaign-Level Budget Allocation
When more budget helps — and when it just gets more expensive
The Budget Dilemma: More Spend, More Revenue?
One of the most common questions in Google Ads management is: Which campaign should get more budget? The answer seems simple — give more to what performs best. But in practice, this logic often fails.
More budget doesn't automatically lead to proportionally more conversions. Beyond a certain threshold, costs per conversion rise, ROAS drops, and the additional spend generates diminishing returns. The challenge is knowing where that threshold lies — for each individual campaign.
This article shows how to make data-driven budget decisions at the campaign level using three key signals — and why intuition alone rarely leads to optimal allocation.
The Core Problem: Budgets Without a Data Foundation
Many advertisers allocate budgets based on gut feeling, historical spend, or simple heuristics like 'increase what converts.' But without considering the relationship between spend, efficiency, and market potential, this approach leads to systematic misallocation.
Typical mistakes include scaling campaigns that are already at capacity, underfunding high-potential campaigns that could grow profitably, and maintaining static budgets despite changing market conditions.
According to Google, advertisers who optimize budget allocation based on performance data achieve on average 15–30% more conversions at the same total spend.
Three Signals for Smart Budget Decisions
To evaluate whether a campaign should receive more, less, or the same budget, you need three complementary data points. Each one reveals a different dimension of campaign health and growth potential.
Signal 1: ROAS Trend Over Time
The ROAS (Return on Ad Spend) tells you how efficiently a campaign converts spend into revenue. But a single ROAS number is not enough — you need the trend.
A campaign with a ROAS of 5.0 that has been declining for weeks tells a different story than one with a ROAS of 3.5 that is steadily improving. The trend reveals whether you're approaching diminishing returns or still have room to grow.
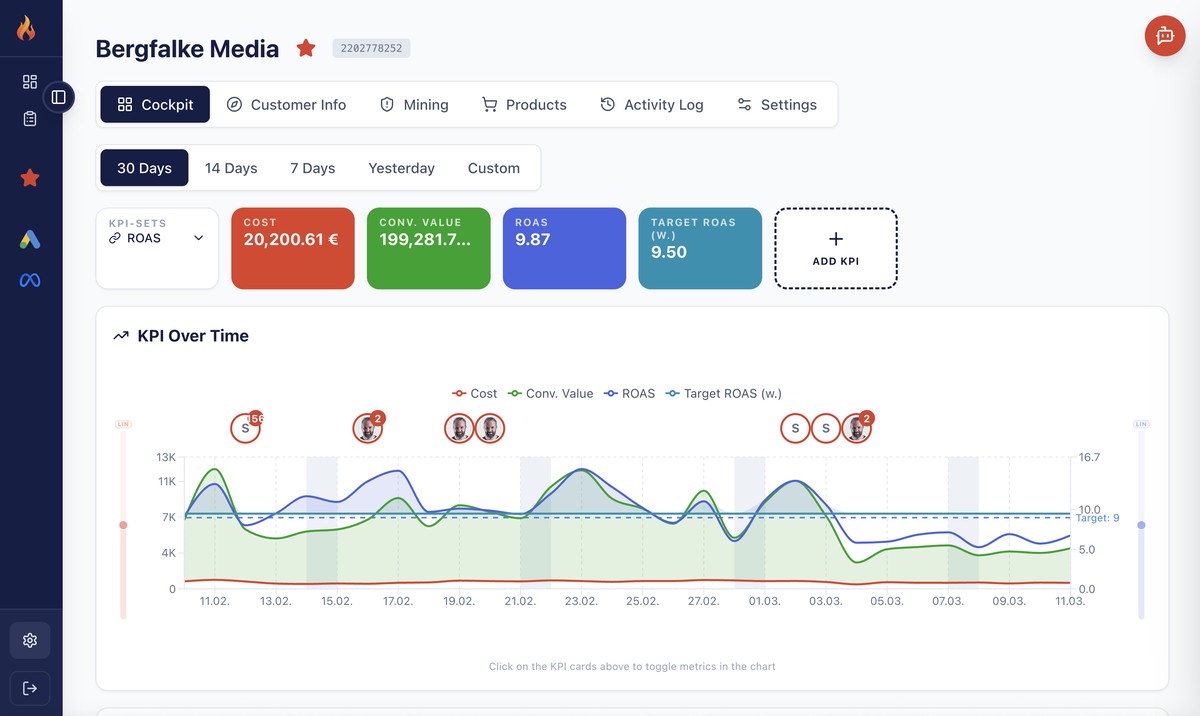
In Firemetrix, the ROAS Cockpit shows cost, conversion value, and ROAS over time in a single view. You can immediately see whether efficiency is stable, improving, or deteriorating — and how the relationship between spend and revenue is evolving.
Signal 2: Impression Share and Lost Impressions
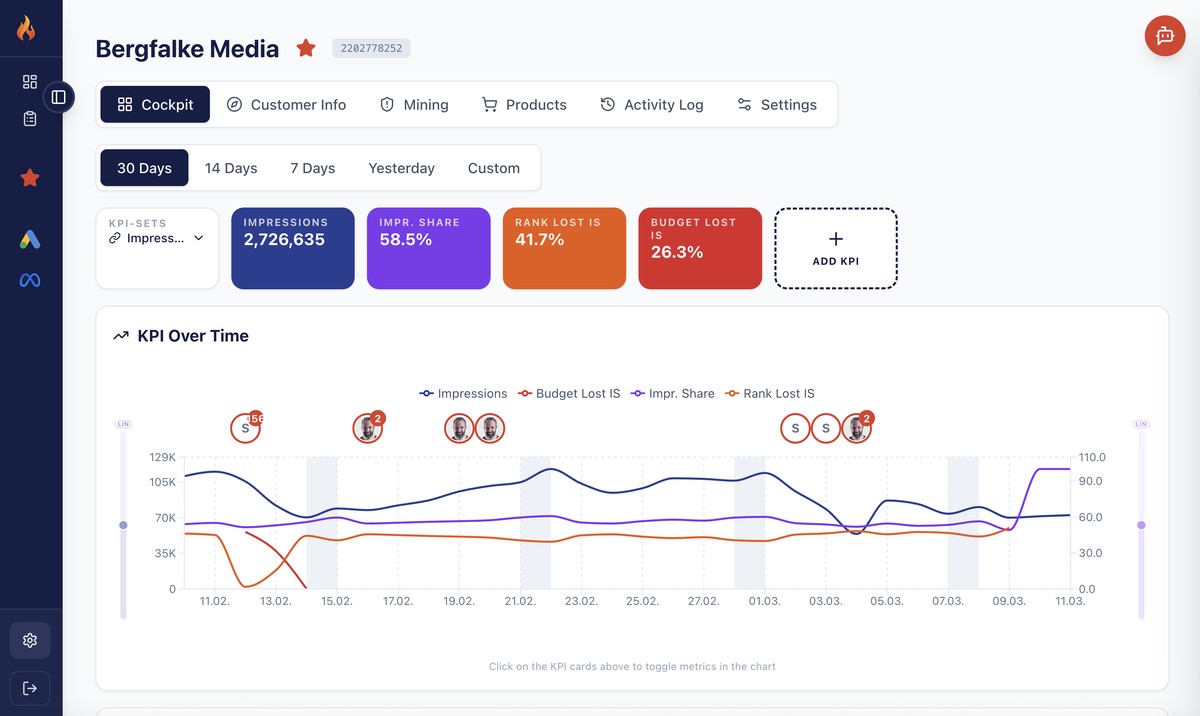
Impression Share tells you what percentage of available impressions your campaign is actually capturing. More importantly, the reasons for lost impressions reveal whether the issue is budget or relevance.
Lost IS (Budget) means your budget is exhausted before all potential impressions are served — a clear signal that more budget could generate additional revenue. Lost IS (Rank) means your ads aren't competitive enough in the auction, and more budget alone won't fix the problem.
A campaign with high Lost IS (Budget) and strong ROAS is the ideal scaling candidate. A campaign with high Lost IS (Rank) needs optimization first — better ads, better landing pages, or better targeting — before additional budget makes sense.
Rule of thumb: If Lost IS (Budget) is above 20% and ROAS is above target, more budget will very likely generate additional profitable conversions. If Lost IS (Rank) dominates, invest in optimization first.
Signal 3: Budget Utilization Over Time
Budget utilization shows how much of your daily budget is actually being spent. A campaign that consistently exhausts its budget may be missing profitable traffic in the later hours of the day.
Conversely, a campaign that never uses its full budget has room for growth — but only if the available traffic is actually converting. Budget utilization without ROAS context is meaningless.
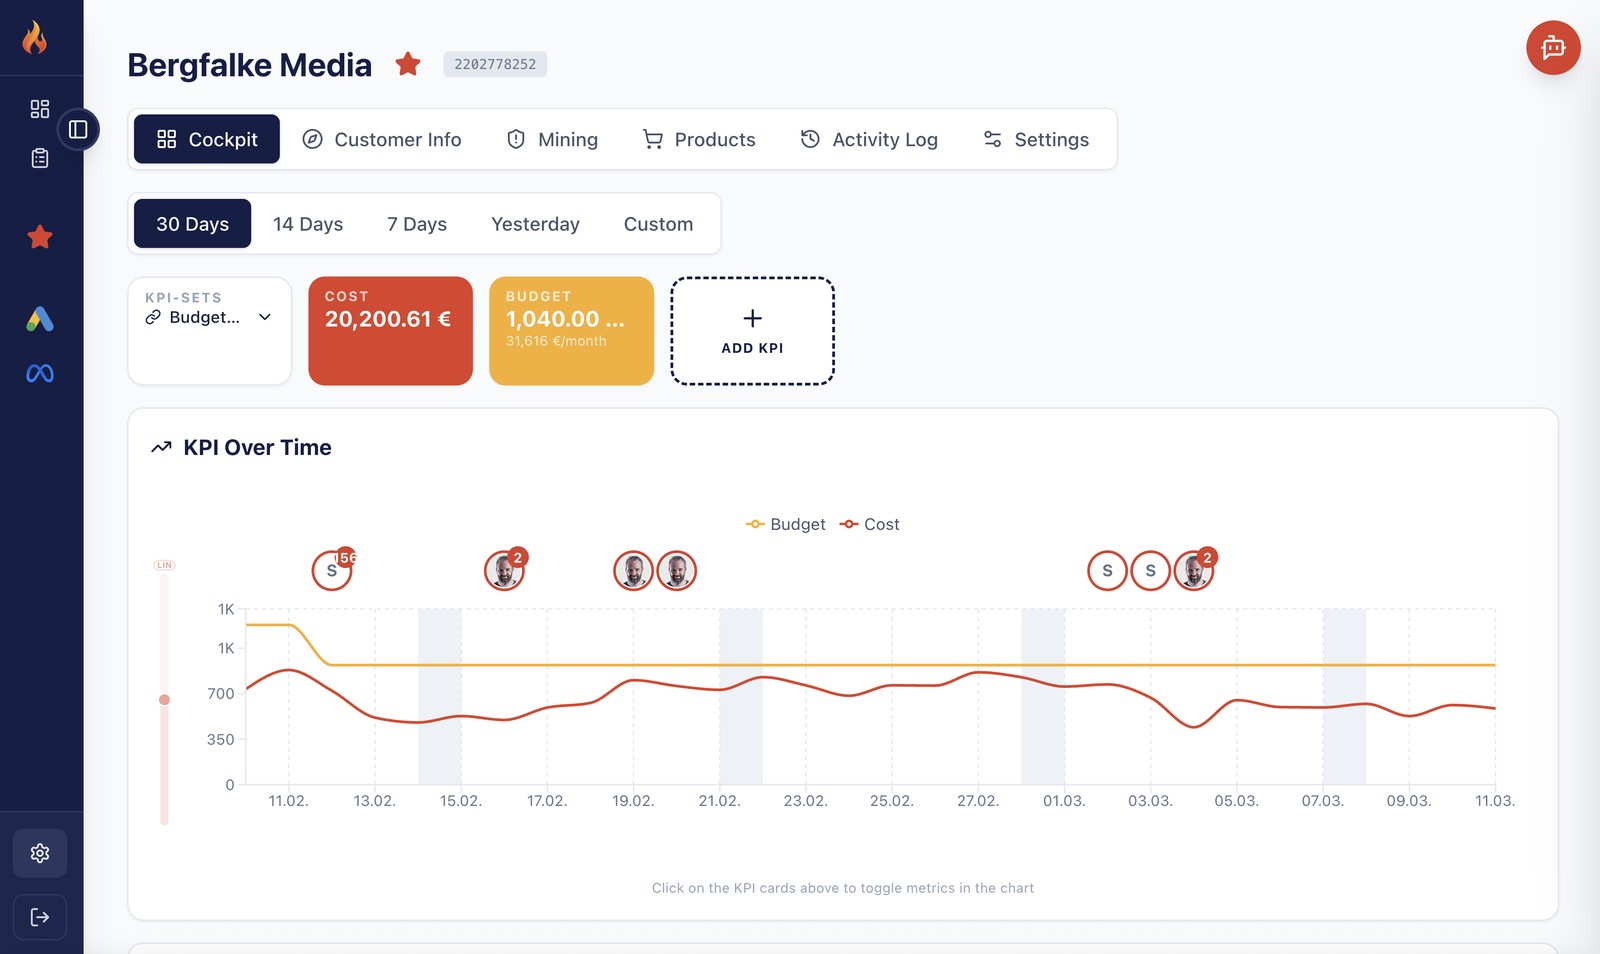
The Budget Cockpit in Firemetrix tracks daily spend against the allocated budget over time. This reveals patterns: campaigns that spike on certain weekdays, seasonal fluctuations, and the gap between budget and actual spend.

Understanding Diminishing Returns
Every campaign has a point where additional spend yields progressively less return. This is the principle of diminishing returns, and it's the single most important concept in budget allocation.
At low spend levels, you're capturing the most valuable, high-intent clicks. As you increase budget, you reach less qualified audiences, compete in more expensive auctions, and your average cost per conversion rises.
The key insight: the optimal budget is not the maximum budget. It's the point where the marginal ROAS of the next euro spent still exceeds your target. Beyond that point, every additional euro reduces your overall efficiency.
Example: Campaign A has a ROAS of 6.0 at €500/day. At €800/day, ROAS drops to 4.5. At €1,200/day, ROAS falls to 2.8. The campaign is profitable at all levels, but the last €400 generates significantly less return per euro than the first €500.
The challenge is that diminishing returns don't announce themselves. They creep in gradually, and by the time you notice the declining ROAS, you may have been overspending for weeks. Continuous monitoring of the cost-to-revenue ratio is essential.
The Portfolio Decision: Scale, Hold, Optimize, or Reallocate
With three signals in hand — ROAS trend, Impression Share, and budget utilization — you can classify every campaign into one of four categories. This framework turns complex data into actionable decisions.
Each category has a clear action path. The goal is not to optimize individual campaigns in isolation, but to allocate budget across the entire portfolio for maximum total return.
Scale
Strong ROAS + high Lost IS (Budget) + full utilization → increase budget for more profitable volume.
Hold
Stable ROAS + moderate IS + good utilization → keep current budget, monitor for changes.
Optimize
Declining ROAS + high Lost IS (Rank) → fix ads, landing pages, targeting before adding budget.
Reallocate
Low ROAS + low utilization → reduce budget and shift to better-performing campaigns.
The Product Level: Where Budget Decisions Get Granular
In Shopping and Performance Max campaigns, budget allocation goes one level deeper. Individual products within the same campaign can have vastly different performance — some with excellent ROAS, others burning budget without returns.
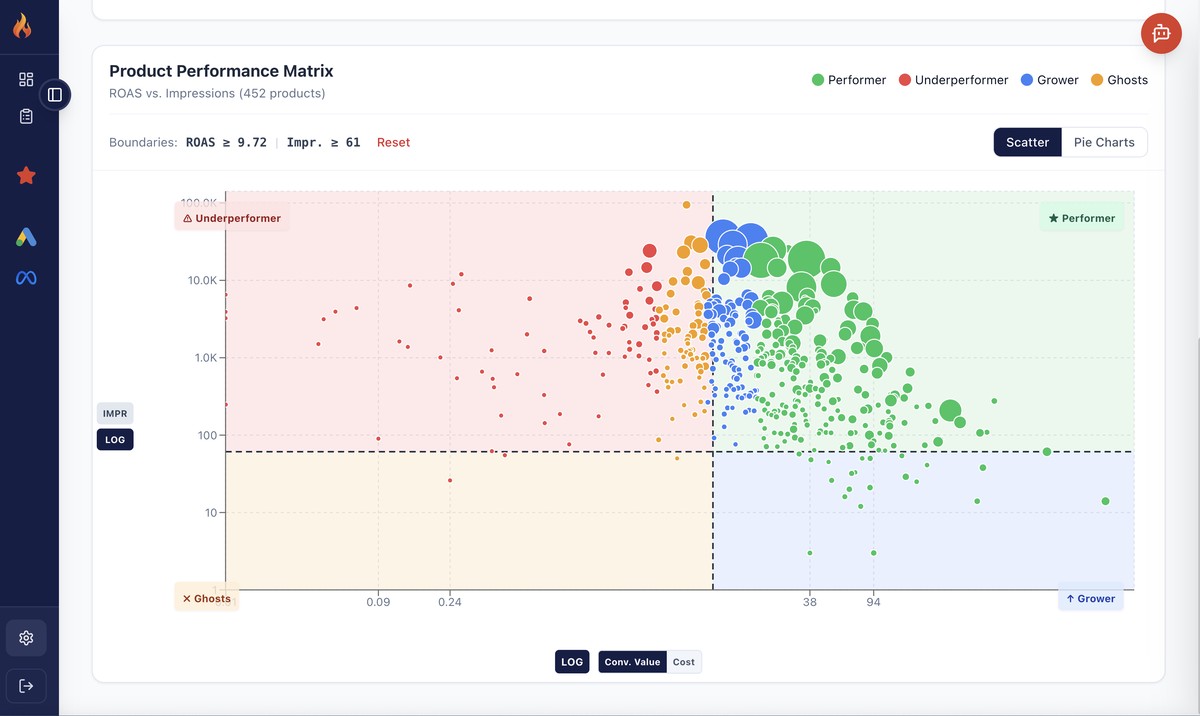
The Product Performance Matrix maps every product by cost and conversion value, revealing which products drive your campaign's success and which are dragging it down.
This insight is critical for budget decisions: a campaign might have mediocre overall ROAS not because the budget is too high, but because a handful of unprofitable products are consuming a disproportionate share. Fixing product-level issues can unlock scaling potential without any budget increase.
Before increasing a Shopping or PMax campaign budget, always check the product-level data. Excluding or restructuring underperforming products often has a bigger impact than adding more spend.
Why Manual Budget Management Doesn't Scale
Checking ROAS trends, Impression Share, budget utilization, and product performance across dozens of campaigns is a daily task. With manual tools — spreadsheets, Google Ads UI, Looker Studio reports — this analysis is time-consuming and error-prone.
The data lives in different places, requires different queries, and changes daily. By the time you've analyzed everything, the situation may have already shifted. Manual processes create lag, and lag costs money.
Effective budget allocation requires real-time visibility across all three signals simultaneously, for every campaign in the account. This is exactly what tools like Firemetrix are built for.
How Firemetrix Supports Smart Budget Allocation
Firemetrix consolidates all budget-relevant signals into a single dashboard, updated automatically. Instead of switching between reports, you see the full picture at a glance.
ROAS Monitoring
Track ROAS trends over time for every campaign. Spot declining efficiency before it impacts your bottom line.
Impression Share Analysis
See exactly where you're losing impressions — and whether more budget or better optimization is the answer.
Product Intelligence
Drill into product-level performance to find hidden opportunities and stop budget waste at the source.
The goal is to make budget allocation a data-driven process, not a quarterly guessing game. With continuous monitoring, you can shift budgets proactively — before diminishing returns erode your margins.
Conclusion
Budget allocation at the campaign level is not about spending more — it's about spending smarter. The three signals — ROAS trend, Impression Share, and budget utilization — provide the framework for making informed scaling decisions.
Campaigns that show strong efficiency, budget constraints, and available market demand should be scaled. Those with declining returns or structural problems need optimization first. And underperforming campaigns should have their budgets reallocated to where they generate more value.
The key to sustainable Google Ads growth is treating your campaign portfolio like an investment portfolio: diversified, data-driven, and continuously rebalanced based on real performance data.