Product Ad Segmentation: How to Use Merchant Center Data for Better Bids and Pricing Strategies
Stop managing Shopping campaigns at the campaign level. Learn how to leverage benchmark prices, recommended offer prices, and smart segmentation from Merchant Center to systematically boost your ROAS at the product level.

Mastering Product Ad Segmentation
How to Use Merchant Center Data for Better Bids and Pricing Strategies
Shopping campaigns are the most important channel for many e-commerce advertisers. Yet most still manage their product ads at the campaign or, at best, product group level — leaving enormous potential on the table. Google provides a wealth of data in the Merchant Center that almost nobody uses systematically: benchmark prices, recommended offer prices, click potential, and competitive data.
In this article, we'll show you how to combine this data with intelligent segmentation to make better bidding decisions at the product level, develop data-driven pricing strategies, and deploy promotions with precision.
Why Product Segmentation Is the Key to Profitable Shopping Campaigns
The default setup in Google Ads treats all products equally: one bid, one budget, one strategy. The problem is obvious — a bestseller with a 15% margin needs a completely different bidding strategy than a niche product with a 40% margin that sells only three times a month.
Product segmentation means dividing your products into meaningful groups based on performance and attribute data, then managing each group individually. The most common segmentation axes are margin and profitability, price position relative to competitors, conversion rate and ROAS history, and product category and seasonality.
Rule of thumb: The more granular your segmentation, the more precisely you can bid. But too many segments make management unwieldy. A good starting point is 4 to 8 segments per account.
The Gold Mine in Merchant Center: What Data Google Provides
Merchant Center is more than just the place where you upload your product feed. Google enriches your products with competitive data that most advertisers completely ignore. Yet this data is exactly the key to data-driven decisions.
Benchmark Prices: What the Competition Charges
For many products, Google shows you a benchmark price — the average price at which other retailers offer the same or a very similar product. This information is pure gold because it immediately tells you whether you're price-competitive or not.
A product priced 20% above the benchmark will struggle in Shopping ads — no matter how high you bid. Conversely, a product priced well below the benchmark can capture a disproportionate share of clicks and conversions with more aggressive bids.
Example: Your product costs €49.90, the benchmark is €42.00. You're 19% more expensive. Instead of investing more budget, you should either adjust the price, create a bundle deal, or reduce your bid and redirect the budget to products with a better price ratio.
Recommended Offer Price: Google's Pricing Hint
Beyond benchmark prices, Google provides a recommended offer price for selected products. This is based on the current competitive landscape and estimated demand. The recommended price isn't a guarantee for more sales, but it's a strong signal for where the sweet spot between competitiveness and margin lies.
It gets particularly interesting when you compare the recommended offer price with your own margin. Is the recommended price above your pain threshold? Then you have room for a promotion. Is it significantly below? Then this product might not be a good candidate for aggressive Shopping campaigns.
Click Potential and Impression Share
Merchant Center also shows you how much visibility you have compared to the maximum possible share. A low impression share with a high conversion rate is a clear signal: it's worth increasing your bid here. A high impression share with poor ROAS, on the other hand, indicates a pricing or relevance problem.
From Data to Decisions: 4 Strategies for Practice
Strategy 1 — Price-Position-Based Bidding
Divide your products into three groups: below benchmark, at benchmark level, and above benchmark. Define a separate bidding strategy for each group. Products below the benchmark receive more aggressive bids because click probability and conversion rate are typically higher. Products above the benchmark receive more conservative bids or are separated into a dedicated campaign with a lower budget.
Benchmark rule: Products priced 10%+ below the benchmark price have on average a 25–40% higher click-through rate in Shopping ads. Leverage this advantage with higher bids.
Strategy 2 — Dynamic Price Adjustments Before Promotions
The recommended offer price is especially valuable for planning sales and promotions. Instead of giving a blanket 20% discount on everything, you can selectively discount the products where the gap between your price and the recommended offer price is largest — where the biggest leverage lies.
The workflow: Export the Merchant Center data, identify products with a large price gap, calculate the minimum discount needed to match or beat the recommended price, and include exactly those products in the promotion. This maximizes impact with minimal margin loss.
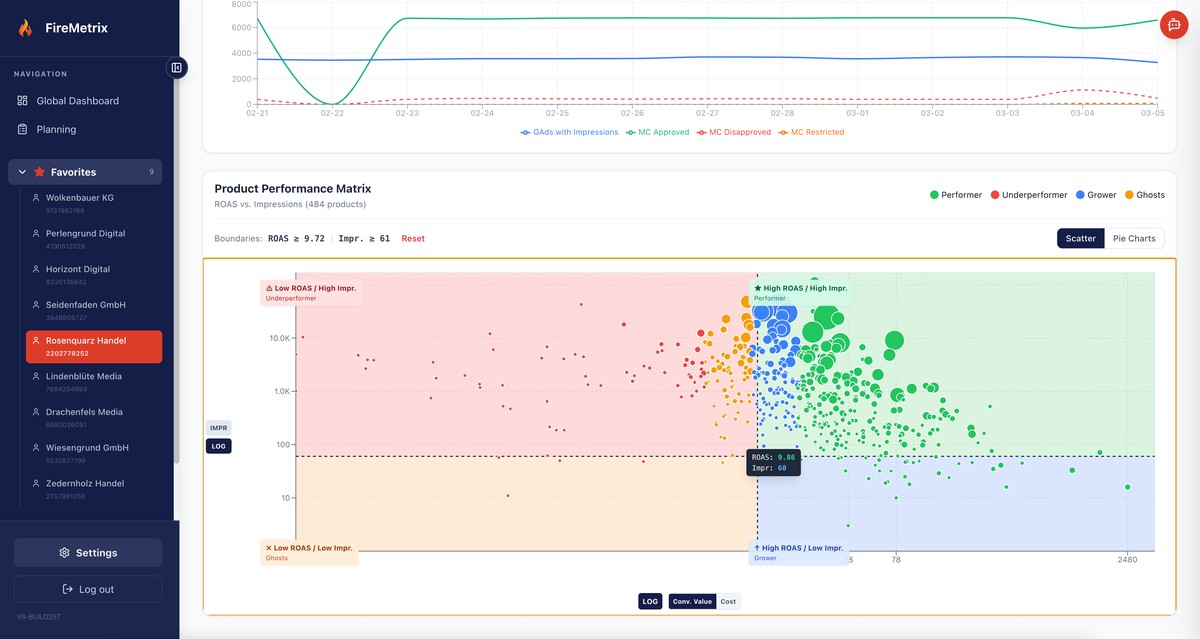
Strategy 3 — ROAS Segments with Price Overlay
The classic segmentation by ROAS (top performers, middle tier, low performers) becomes much more powerful when you combine it with price position. A product with low ROAS and a high price relative to the benchmark has a clear pricing problem. A product with low ROAS but a fair price may have a relevance or landing page problem.
This two-axis analysis helps you choose the right action: adjust the price, reduce the bid, optimize the ad, or remove the product from the campaign.
Strategy 4 — Leveraging Seasonal Benchmark Shifts
Benchmark prices aren't static. Before Black Friday, during the holiday season, or at seasonal transitions, prices shift across the entire market. Those who detect these shifts early can proactively adjust their bids and prices instead of reactively playing catch-up.
Track the benchmark trends of your top products weekly. When benchmarks drop, competitors are pulling prices down — a signal that you should either follow suit or reallocate your budget to more stable segments.
The Scaling Problem: Why Manual Product Management Hits Its Limits
These strategies sound logical — and they are. But in practice, they often fail due to sheer volume: a typical e-commerce account has hundreds to thousands of products. Manually exporting Merchant Center data, linking it with performance data, creating segments, and adjusting bids takes hours — and is already outdated by next week.
For agencies that need to perform this analysis for multiple clients, the effort multiplies again. The consequence: most stick with rough segmentation and leave the granular Merchant Center data unused.
Automated Product Analysis with Firemetrix
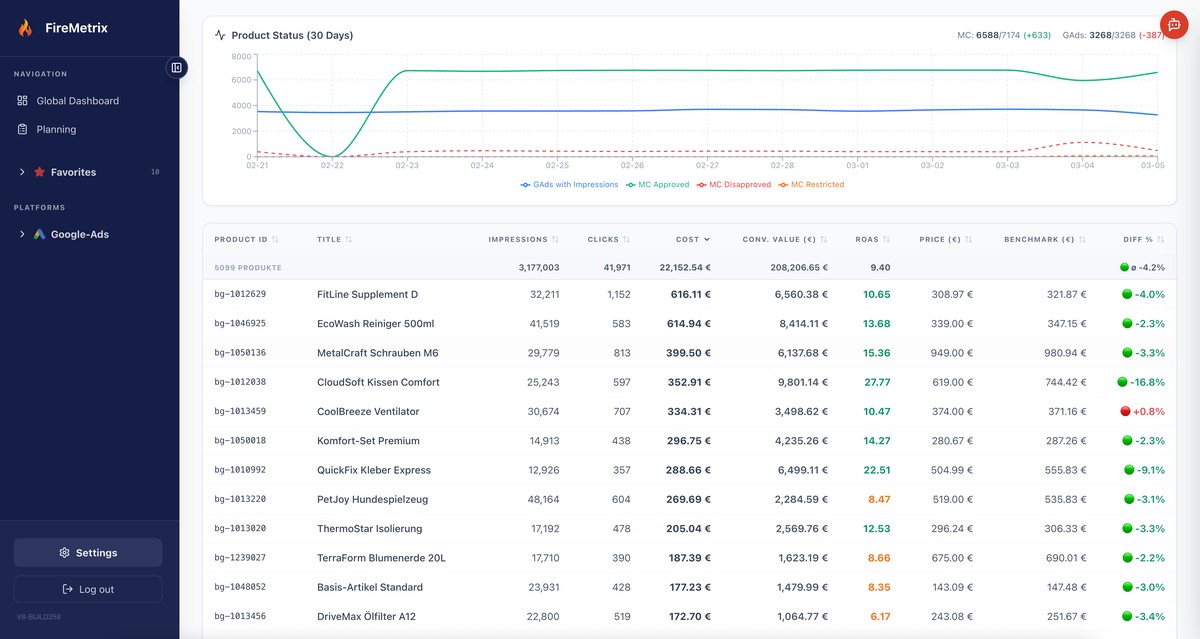
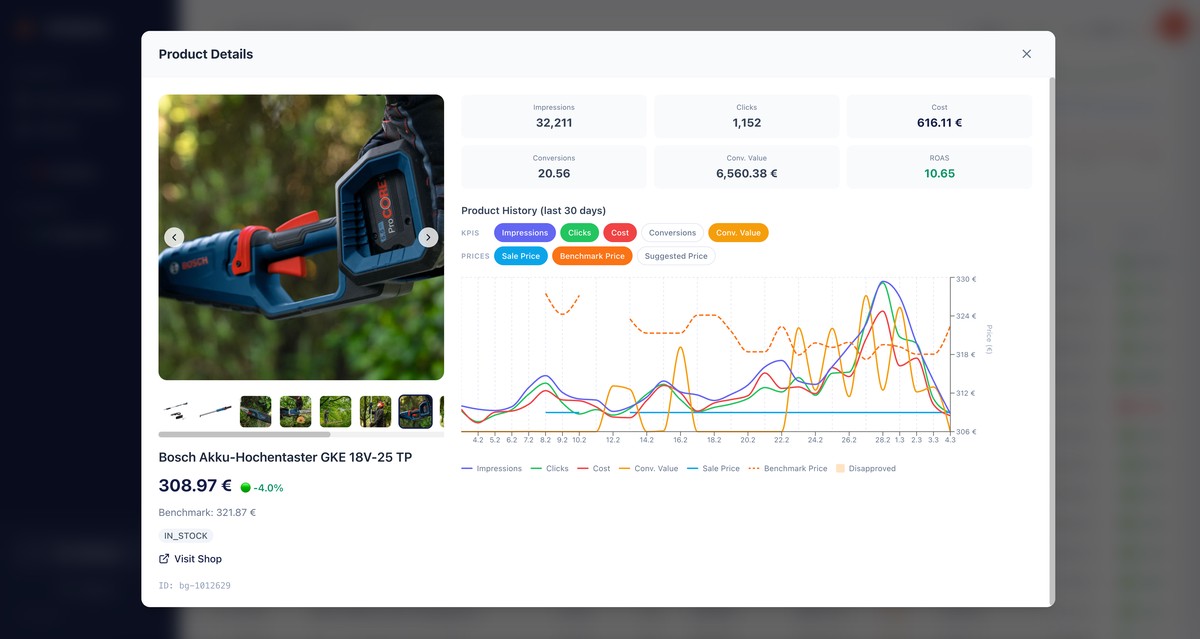
This is exactly where Firemetrix comes in. The platform automatically imports Merchant Center data — including benchmark prices, recommended offer prices, and competitive metrics — and links them with Google Ads performance data at the product level.
Price Benchmark
Automatic comparison of your prices against the market benchmark for every product
ROAS per Product
Performance metrics at the individual product level instead of the campaign level
Pricing Strategy
Identify products with pricing potential based on benchmark and margin data
Instead of spending hours filling spreadsheets, you can see at a glance which products are well-positioned on price, which have a pricing problem, and where a bid adjustment or promotion is worthwhile. Data is automatically updated, so your segmentation is always current.
Conclusion: Your Product Data Is the Underrated Performance Lever
Most Shopping advertisers optimize at the campaign or ad group level and miss the biggest lever: the product level. Google provides valuable competitive data through the Merchant Center — benchmark prices, recommended offer prices, click potential — that show you exactly where opportunities lie and where you're wasting budget.
The combination of intelligent segmentation and Merchant Center data enables data-driven bids instead of guesswork, targeted promotions instead of blanket discounts, and a campaign structure that reflects the actual competitive situation of each individual product.