All Features 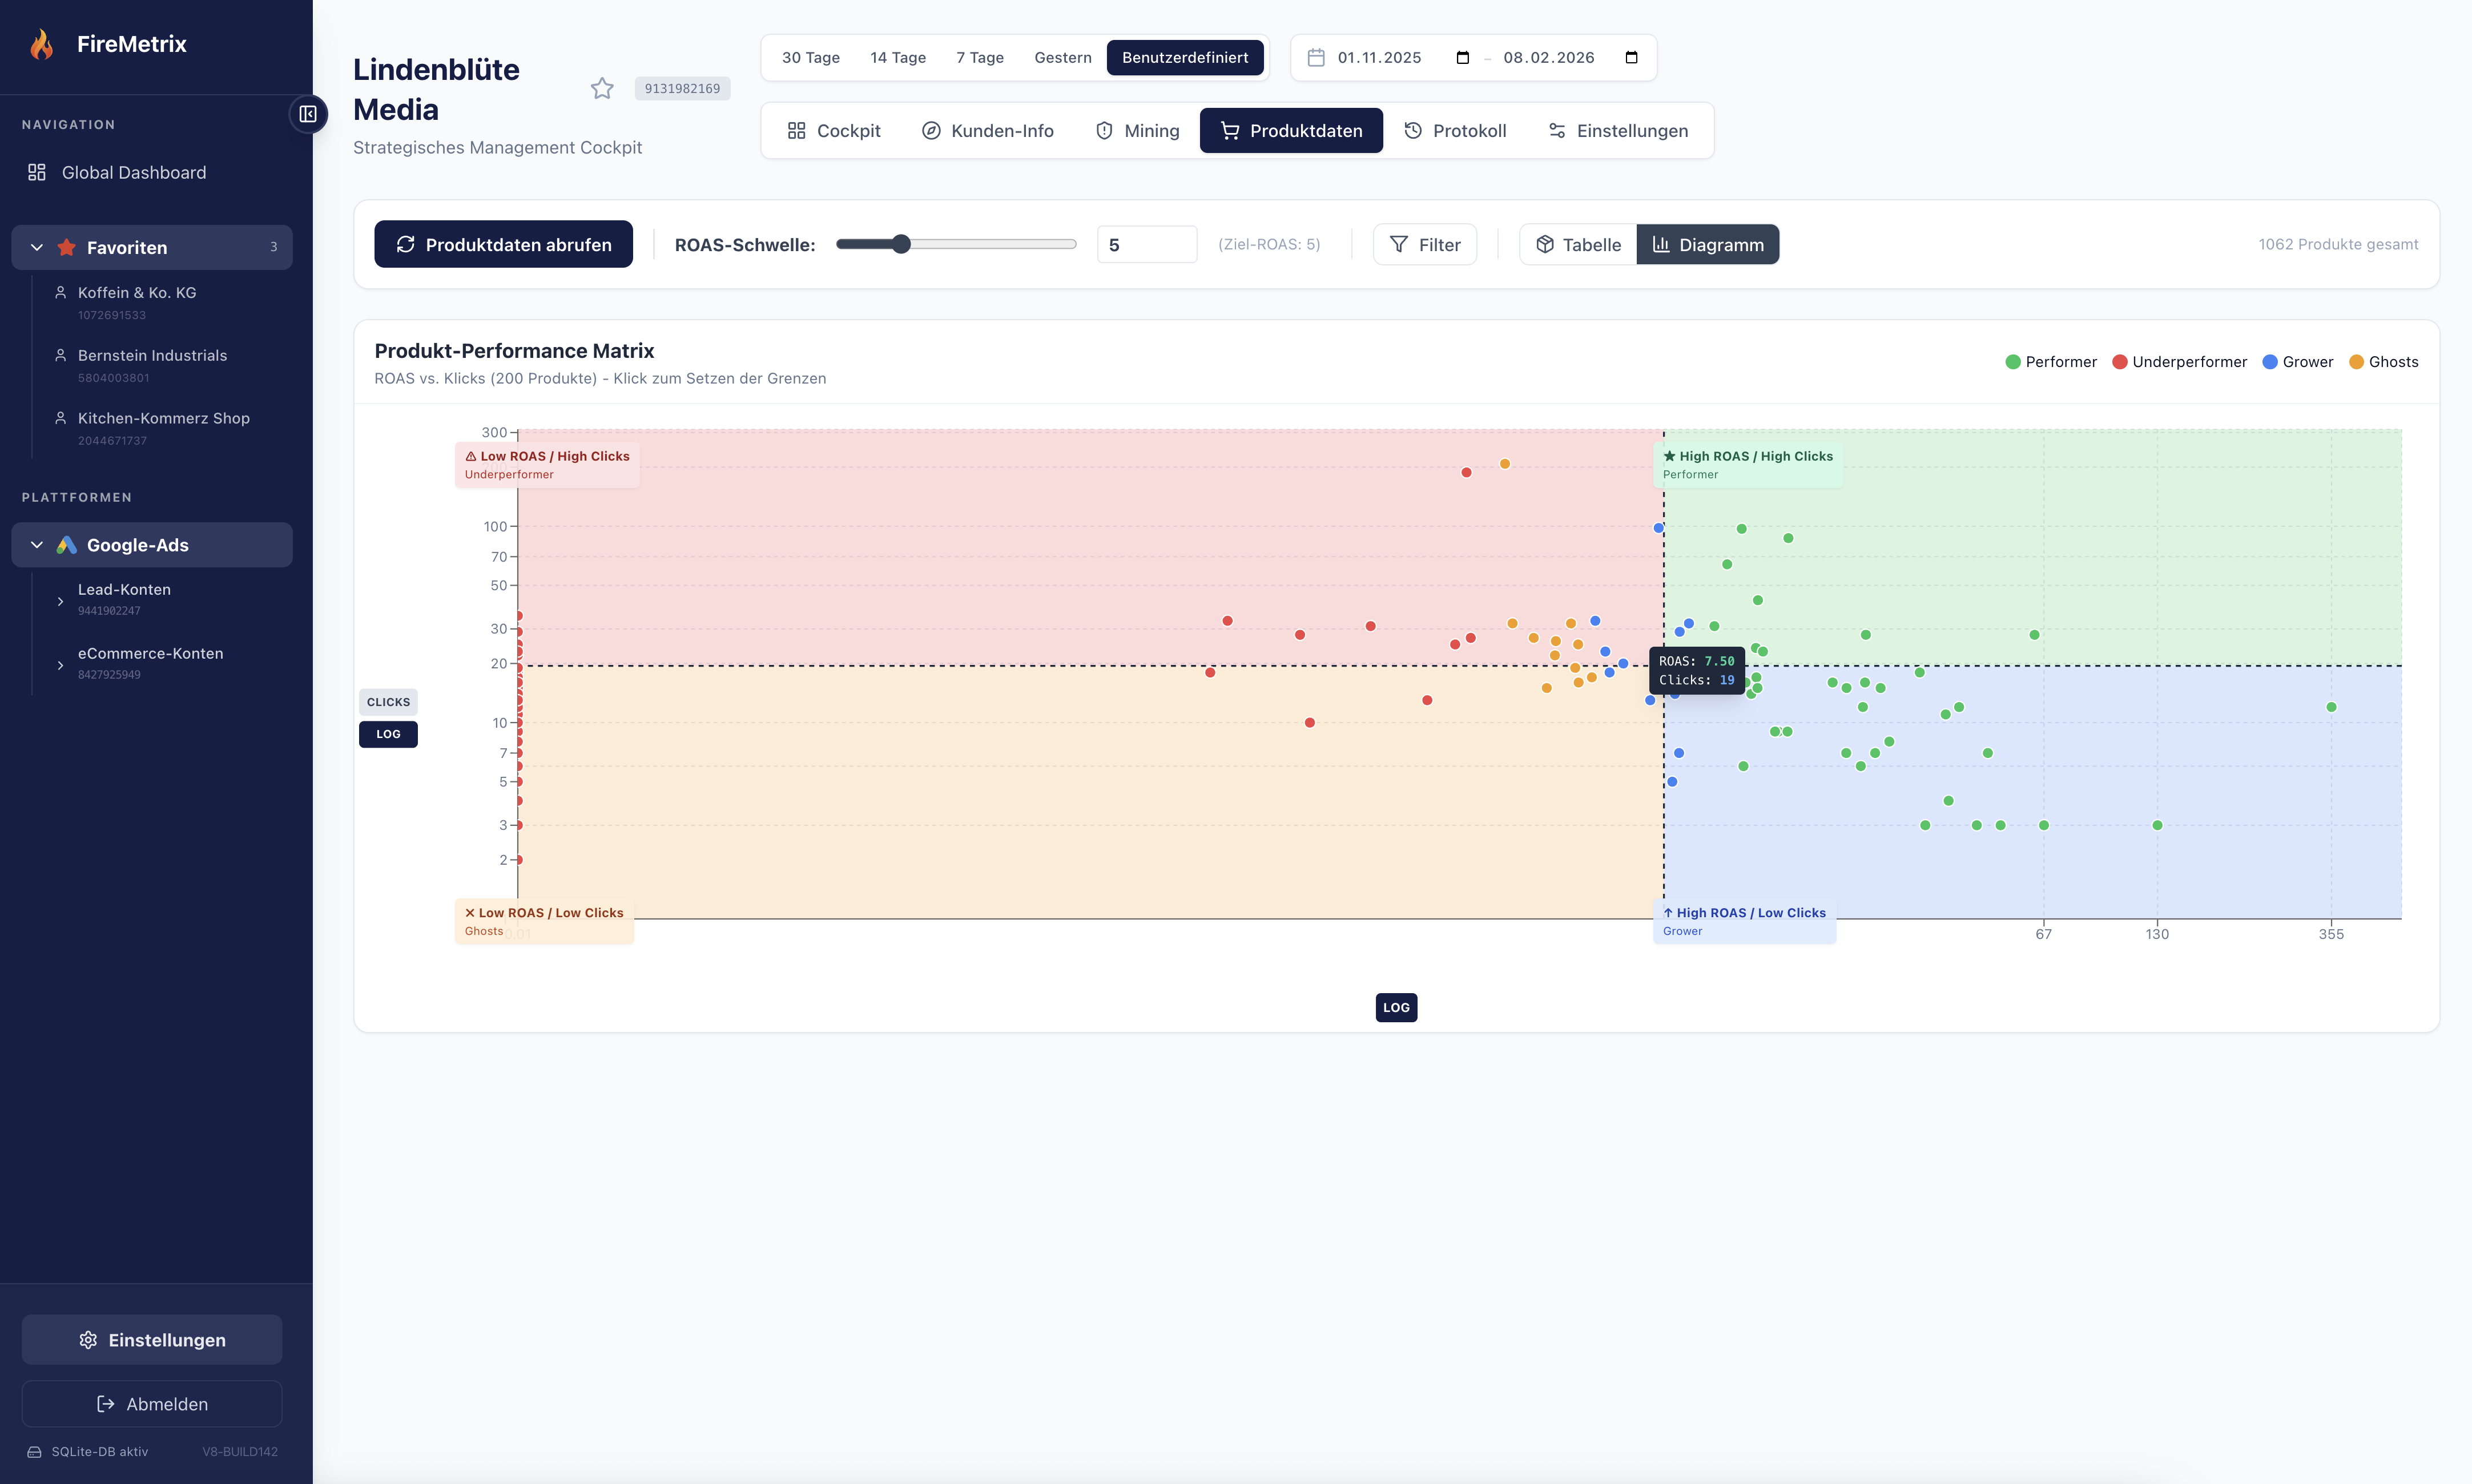
ROAS vs. Clicks — visually analyzed
Product Performance Matrix
The scatter plot analysis automatically categorizes your products into Performers, Underperformers, Growers, and Ghosts. Set ROAS thresholds and identify optimization potential at a glance. Instantly understand which products drive profit and which burn budget.
Start for Free Benefits
Automatic categorization: Performers, Underperformers, Growers, Ghosts
Visual scatter plot analysis (ROAS vs. Clicks)
Adjustable ROAS thresholds
Instant identification of optimization potential
Ready to get started?
Try FireMetrix for free and experience how easy data-driven Google Ads management can be.
Start for Free