All Features 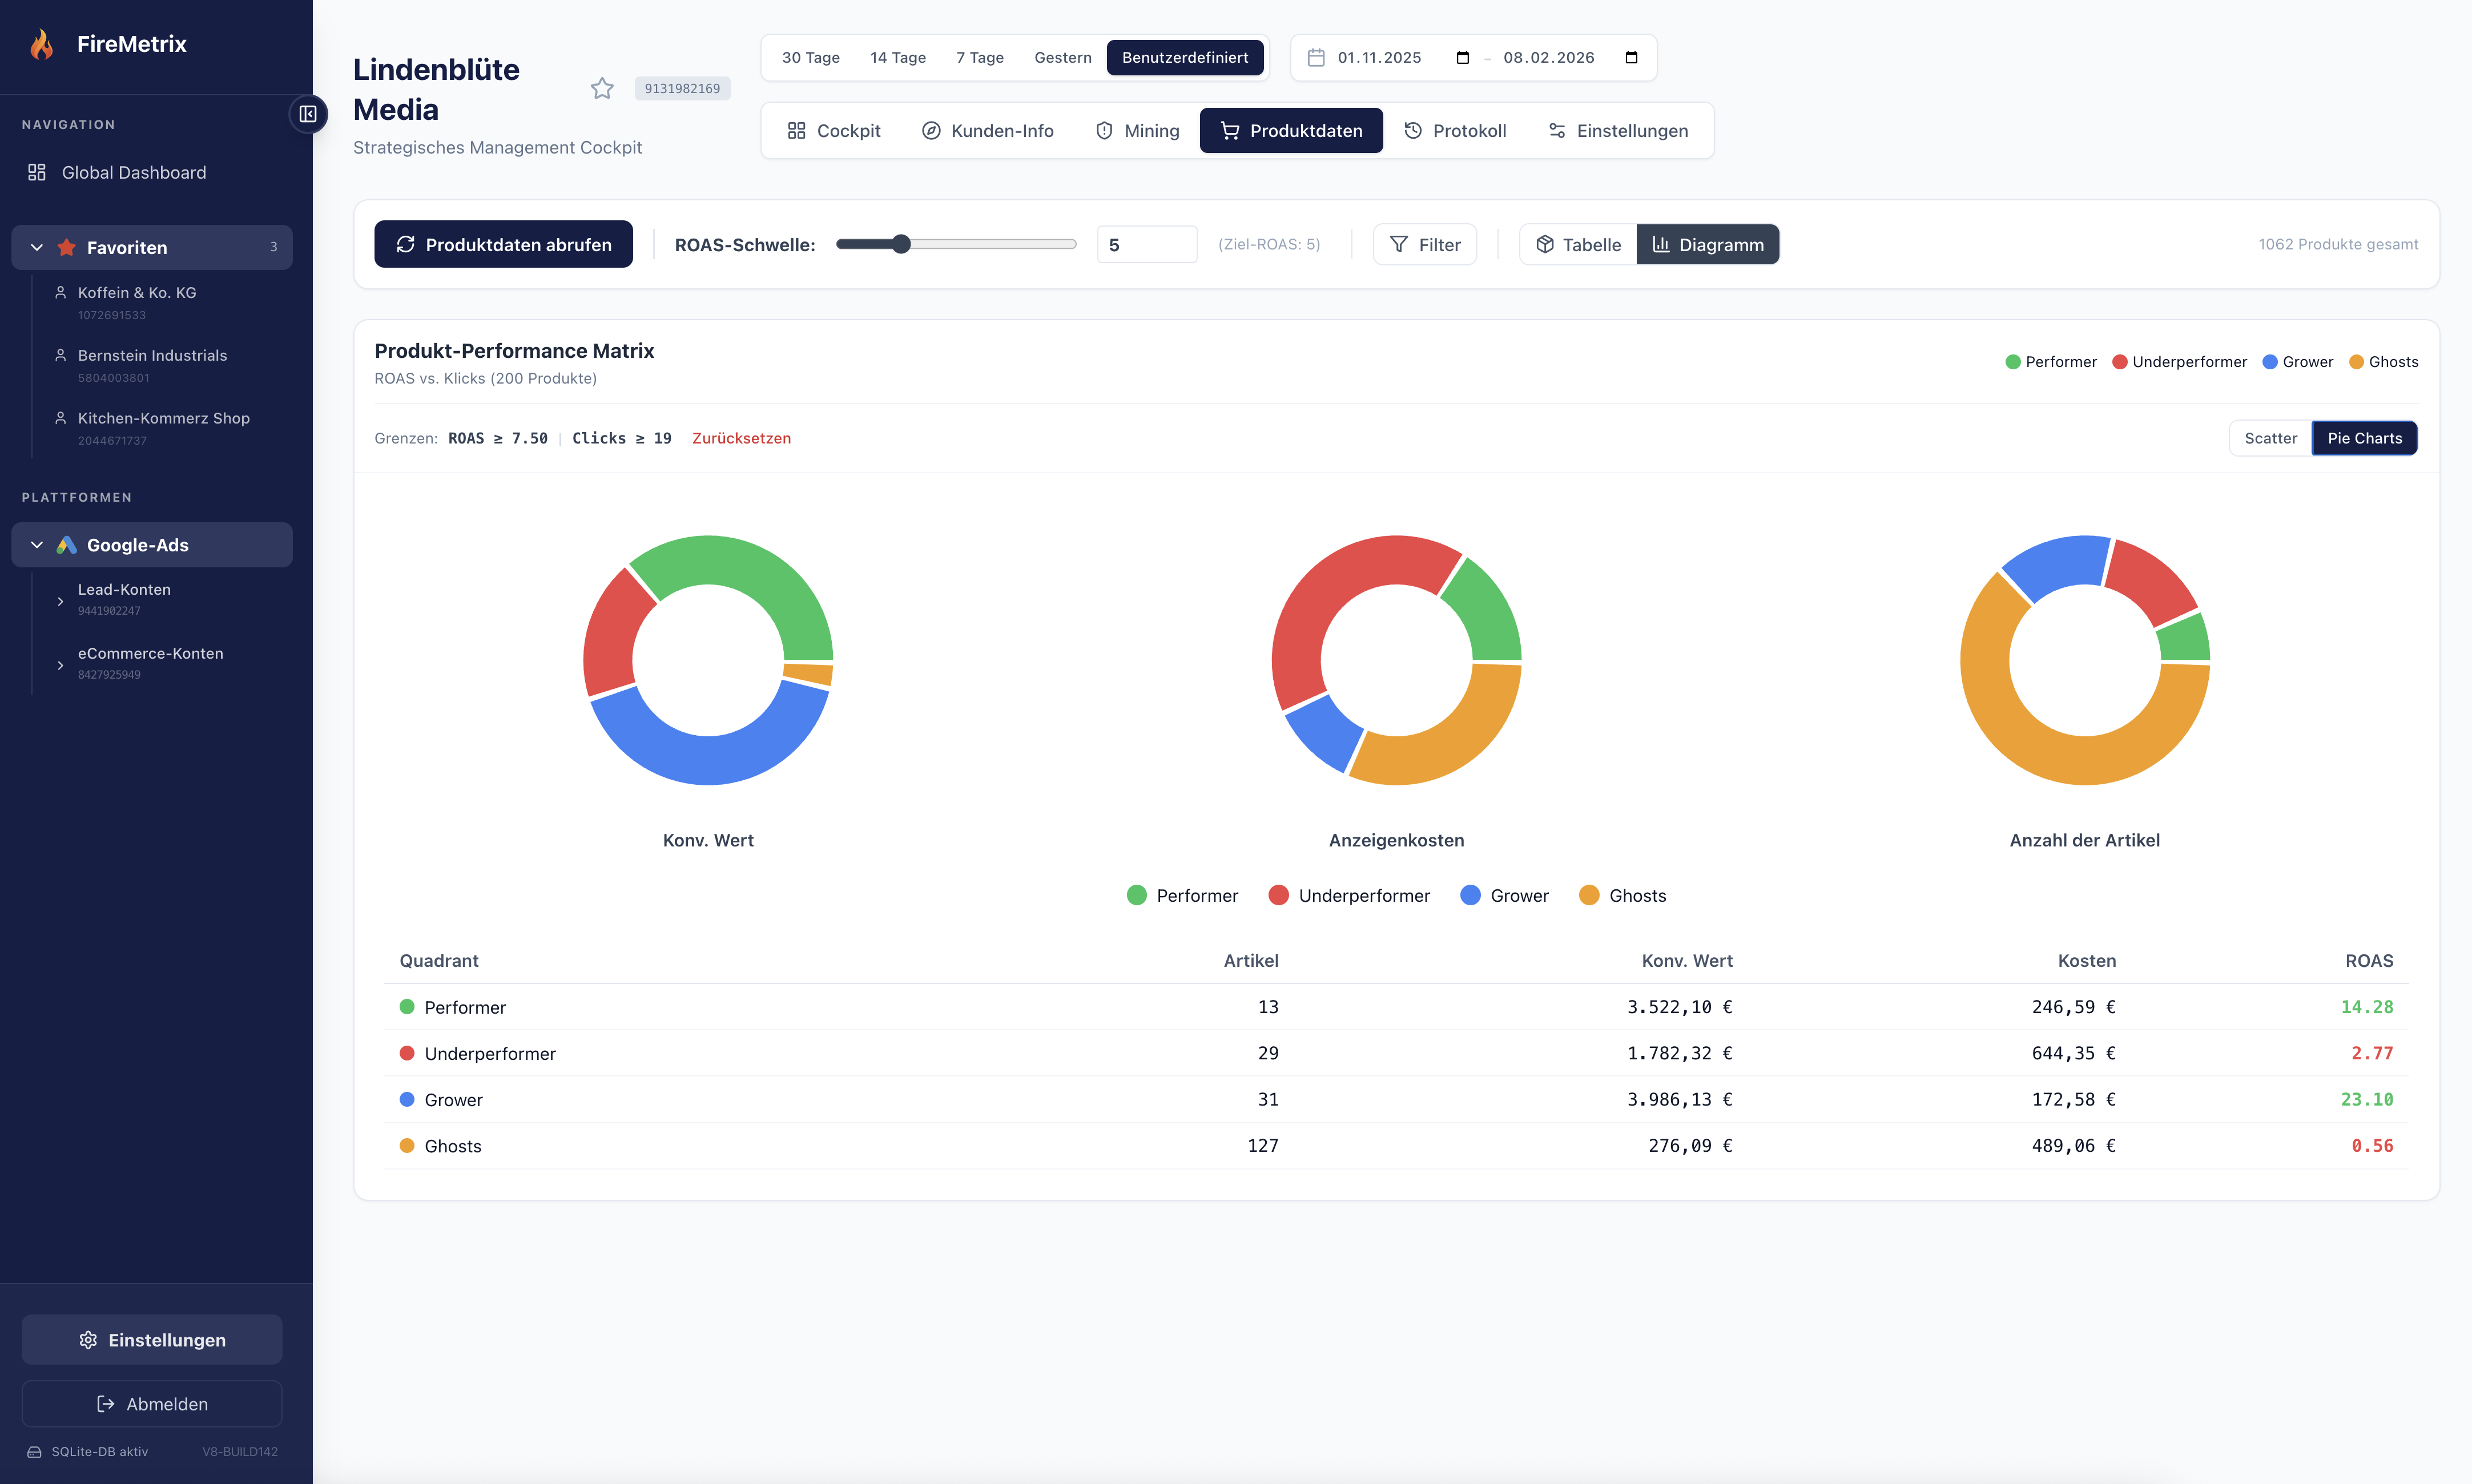
Performers, Underperformers, Growers & Ghosts
Segment Analysis
Pie charts and tabular reports show the distribution of your products by performance segment. Understand how conversion value, ad costs, and ROAS are distributed across segments. Make data-driven decisions about budget allocation.
Start for Free Benefits
Clear segmentation: Performers, Underperformers, Growers, Ghosts
Pie charts and tabular reports
Conversion value and ROAS per segment
Data-driven budget allocation
Ready to get started?
Try FireMetrix for free and experience how easy data-driven Google Ads management can be.
Start for Free